Time Series#

Reactor Trouble#
Alert! The anti-matter reactor of the ship has become unstable. High-energy particles start drifting in random directions. As it is the matter with anti-matter, it might easily turn your ship into a fireball if the particle displacement becomes too large.
Fortunately your engineers say this should be easy to fix. All you need to do is to measure the displacement over time and recalibrate the reactor.
Here is the data:
import numpy as np

displacement = np.random.normal(size=200)
Create a Time Series#
Handling timestamps is one of the strongest features in pandas.
Most of the time, you will want the timestamps to be in the row index.
With pandas.date_range() you can create series of timestamps from scratch:
import pandas as pd

s = pd.Series(
    data = displacement,
    index = pd.date_range("2023-03-09", freq="D", periods=200),
    name = "reactor_temp",
)
s.head()
Instead of a pd.Series object you could also use a DataFrame, allowing for multiple columns.
In both cases, a pandas.DateTimeIndex is used to track data over time.
You could also create timestamps specifying both boundaries and a number of periods:
pd.date_range("2023-03-09 08:22:00", "2023-03-09 16:00:00", periods=200),
Timestamps from Strings#
Parsing strings to timestamps is very convenient.
pandas understands plenty of different formats.
This makes your life much easier, e.g. when parsing the log files of an anti-matter reactor.
pd.to_datetime(
    ["2020", "September 16th, 2020", "2020 Sep 16 11:11", "2020/09/16", "09/16/2020"],
    day_first=False
)
Technically, the timestamps are stored in integers and measured in nanoseconds since the Unix epoch on Jan 1st, 1970 when the first Unix machine officially started to tick.
Note
When reading timestamp columns from a CSV file, the option parse_dates=True is a useful shortcut if the timestamp is the index. Otherwise parse_dates=['col_name'] works as well.
Plotting Time Series#
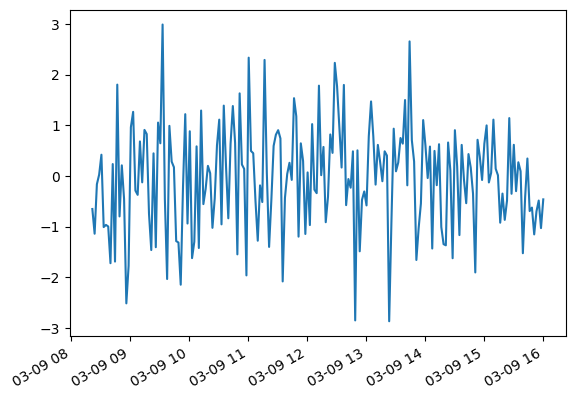
When plotting a time series, pandas automatically uses the time index for the x-axis:
s.plot()
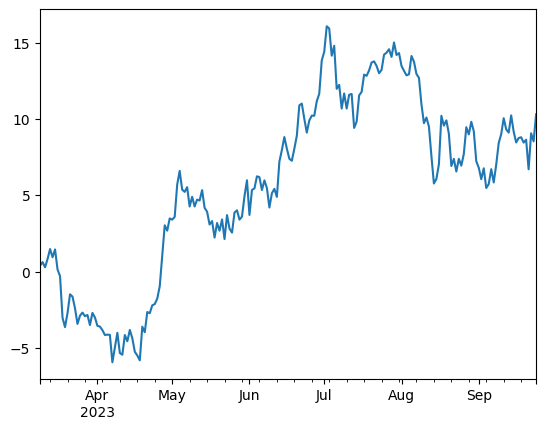
A frequently used trick is to sum up values with a cumulative sum. The random data becomes a random walk. You see that the small changes add up over time and the data is drifting. Note that the resulting data still has a similar timestamp index:
ts = s.cumsum()
ts.plot()
pandas decides on the fly whiich scale and which ticks to use for the x-axis.
This works well almost all the time:
Accessing DateTime Attributes#
Every DateTimeIndex has a couple of useful fields that can be accessed:
ts.index.year
ts.index.month
ts.index.hour
ts.index.weekday
ts.index.minute
ts.index.month_name()
ts.index.day_name()
Indexing and Slicing#
Timestamp indexes can be indexed and sliced comfortably using string intervals:
ts['1/10/2011']
ts["2023-03-20":"2023-04-17"]
ts[datetime(2011, 1, 7):]
ts['1/6/2011':'1/11/2011']
Resampling#
A frequent task is changing rows so that different intervals between the time stamps are used. There are two types of resampling.
Downsampling condenses the data (fewer rows).
Like with df.groupby(), you need to specify, how the rows should be aggregated:
ts.resample("1M").mean()
ts.resample("2W").sum()
ts.resample("10d").first()
Upsampling changes the index to a wider timescale (more rows). The resulting gaps need to be filled or interpolated, otherwise they stay empty:
ts.resample("6h10min").first()
ts.resample("6h10min3s").ffill()
ts.resample("6h").first().interpolate()
See also
Check out the table with Offset aliases in the pandas Time Series documentation
Rolling Mean#
A frequent type of aggregation is the rolling mean (or moving average). It shifts a window of N data points over the time series and returns a value for each position. This smoothes out noise in the data.
ts.rolling(window=10).mean()
ts.rolling(window=10).std()

ts.rolling(window=10).mean().plot()
Try different window sizes and see how the curve becomes smoother and smoother.
.rolling() also works for rolling standard deviations and custom functions.
See also
You can find more examples in the pandas documentation
Recap Exercise: Datetime Indexes#
To prepare for the challenge, create 30 random numbers:
import numpy as np

data = np.random.randint(1, 7, size=30)
Solve the following tasks:
# 1. create timestamps for an entire April, one per day
...

# 2. display the year for each timestamp
...

# 3. display the weekday for each timestamp
...

# 4. create a Series with the random data and the timestamps as index
...

# 5. select the timestamps until the 11th
...

# 6. calculate the sum of all numbers for each week
...

# 7. calculate a rolling average with a 7-day window
...