Read and Write Data#
Star Map#

The known universe is divided into three sectors, of which the first is inhabited by giant amoeba, the second by penguins, the third by cute bears called xiong mao in their own language, in ours simply pandas. All of them differ in their customs, operating systems and favorite programming language. But they are generally friendly.
Before your spaceship can travel anywhere, you need to set a course. To find out where you are going, you want to load the star maps that contain planets in all three sectors:
Read CSV files#
The read_csv function is often the first command used. It has a lot
of optional parameters, 3 of which are shown here:
import pandas as pd

df = pd.read_csv('penguin_sector.csv', index_col=0, sep=',', header=True)
Read Excel files#
Reading Excel spreadsheets works in the same way. There is one subtle difference though: if your column labels are numbers, they are converted to integers, while pd.read_csv() reads them as strings.
df = pd.read_excel('penguin_sector.xlsx', index_col=0)
Read SQL#
You will need to create a DB connection first. Requires installing the
SQLAlchemy package and a DB connection package, e.g. psycopg2 for
PostGreSQL
pip install psycopg2-binary
pip install sqlalchemy
Once the library is installed, you can send SQL queries to your database and get the results as a DataFrame:
from sqlalchemy import create_engine

conn = create_engine('postgres//user:psw@host:port/dbname')
df = pd.read_sql('SELECT * FROM penguins', conn)
Read JSON#
Reading JSON only works if the structure is table-like.
df = pd.read_json('penguins.json')
Read from Clipboard#
This is sometimes useful when improvising
df = pd.read_clipboard()
Concatenate multiple DataFrames#
When reading multiple tabular files that have the same structure, it is sometimes straightforward to combine them into a single DataFrame:
df = pd.concat([df1, df2, df3, ...])
Plot the Star Map#
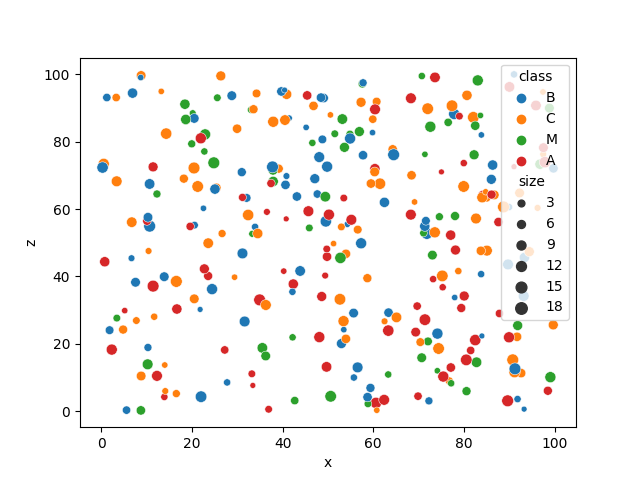
With the seaborn library, you can visualize data from DataFrames with one-liners:
sns.scatterplot(data=df, x='x', y='z', size='size', hue='class')
Here is how your home sector should look like:

Challenge#
How many planets are there in all three star maps combined?
Recap Exercise: Read and Write DataFrames#
Read the file penguin_sector.csv into Python:
import pandas as pd

df = pd.read_csv('penguin_sector.csv', index_col=0, sep=',', header=True)
Solve the following tasks:
# 1. write the data to a CSV file
df...

# 2. read the CSV file to a new DataFrame
...

# 3. write the data to an Excel file
...

# 4. read the Excel file to a new DataFrame
...

# 5. write the data to a JSON file
...

# 6. read the JSON file to a new DataFrame
...

# 7. make sure all data frames have the same shape
assert df.shape == ...
Sources#
The planet names were scraped from everybodywiki.com with the following script:
import requests
import re
import pandas as pd
import numpy as np

base_url = "https://en.everybodywiki.com/List_of_Star_Trek_planets"
char_ranges = ("AB", "CF", "GL", "MQ", "RS", "TZ")
pattern = r'<span id="[^"]+">([^>]+)</span>|<li><b>([^>]+)</b>|<p><b>([^<]+)</b>'

# scrape planet names
names = []
for char_from, char_to in char_ranges:
    url = f"{base_url}_({char_from}%E2%80%93{char_to})"
    page = requests.get(url)
    found_names = re.findall(pattern, page.text)
    print(char_from, char_to, len(found_names))
    names += [''.join(n) for n in found_names]


# create a table with planets
names = np.array(names)
np.random.seed(42)  # the answer to everything
np.random.shuffle(names)
n = len(names)

planets = pd.DataFrame({
    'name': names,
    'x': np.random.random(size=(n,)) * 100,
    'y': np.random.random(size=(n,)) * 100,
    'z': np.random.random(size=(n,)) * 100,
    'class': np.random.choice(np.array(list('MABC')), size=(n,)),
    'size': np.random.randint(1, 20, size=(n,)),
})

# write planets to files
planets.iloc[:300].to_csv('panda_sector.csv')
planets.iloc[300:600].to_csv('penguin_sector.csv')
planets.iloc[600:].to_csv('amoeba_sector.csv')